Voyager
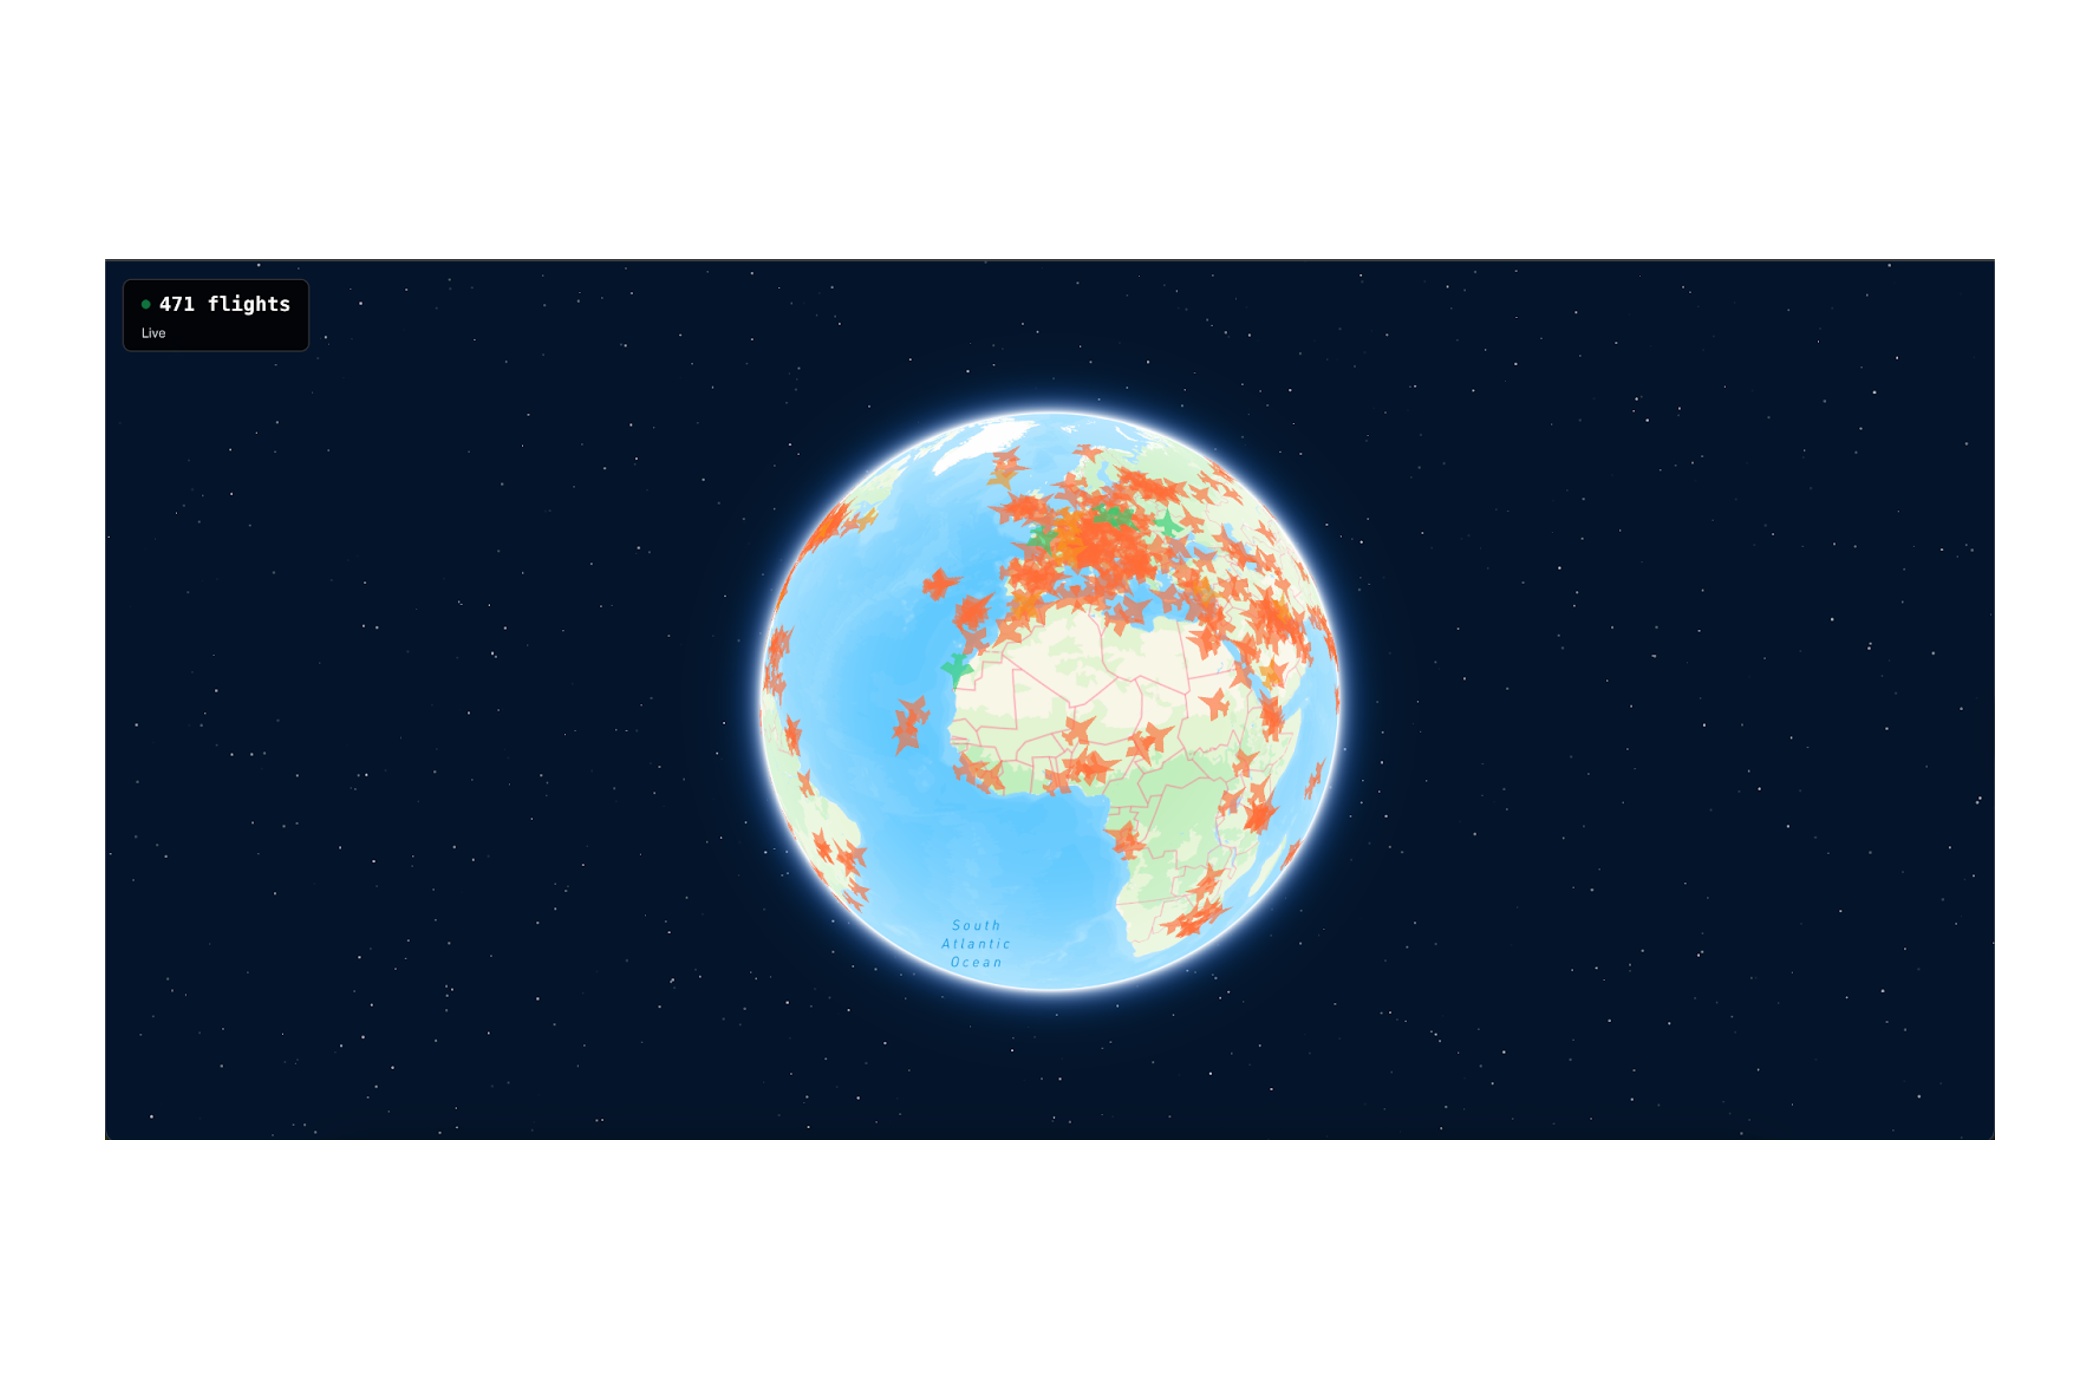
Abstract—Aviation is a high energy sector, and a lot of fuel burn comes from things that are not "productive flying" like holding patterns, reroutes, and congestion near major airports. When conditions change (weather, demand spikes, disruptions), delays stack up, and those extra minutes in the air turn into extra fuel burn and emissions. The annoying part is that it is hard to test interventions in real airspace since controlled experiments are risky, expensive, and you cannot easily replay the same scenario to compare strategies. Voyager is our attempt to study this in a safe and repeatable way. We are building a real time flight simulation that can run on the order of 2,000 aircraft at once, following realistic routes and basic flight phases (takeoff, climb, cruise, descent, landing). The backend publishes aircraft snapshots over WebSockets and a Next.js/React frontend renders them on an interactive Mapbox 3D globe so congestion patterns are easy to spot. The main "systems" twist is that Voyager is instrumented like a production stack since we export metrics, logs, and traces using OpenTeleme- try into Prometheus/Loki/Tempo and visualize everything in Grafana. That lets us measure performance under load (latency, throughput, disconnects) while also collecting traffic outcome signals (delay minutes, reroute rate, holding-like behavior) that we can later translate into fuel and emissions estimates. Index Terms—flight simulation, real time systems, observabil- ity, air traffic I. RECOGNIZE THE NEED (GATHER INFORMATION) A. Problem statement Aviation is a clear example. When flights are slowed, put into holding patterns, or rerouted near busy hubs, fuel burn increases. Some inefficiency is unavoidable, but a lot of it comes from coordination constraints and disruption response (weather, demand surges, unexpected events). B. Why a simulator is useful The core issue is experimentation. Real airspace is hard to test on since it is risky, expensive, and operationally constrained. You cannot safely run controlled A/B tests, and you cannot rewind the real world to replay the exact same disruption scenario. A simulator gives us a safe sandbox to replay stress scenarios, compare outcomes, and build evidence instead of guessing. C. Preliminary research and context Two motivating facts used in our framing are: (1) opera- tional inefficiencies (like suboptimal routing) can cause mea- surable fuel loss, and (2) aviation is a meaningful contributor to global emissions, so modest efficiency gains matter at scale. This motivates building a tool that can make inefficiency observable and repeatable. D. Background: why this is getting harder Air traffic is getting harder to manage for a pretty simple reason since there are more flights, and the system reacts to disruptions in messy ways. Weather shifts, demand spikes, runway changes, and unexpected events can quickly turn into congestion and delay cascades. Most tools today are great at showing what is happening right now, but they do not make it easy to ask "what happens next?" or "what if we tried something different?" A lot of the work is still manual and people look at weather, look at traffic, and make judgment calls. That is where a simulator helps, and it is also where a lightweight analytics/prediction layer could eventually help by pointing out emerging hotspots earlier. E. Existing approaches and gap Most flight trackers focus on showing real-time position. They are great for situational awareness, but they are not built for repeatable disruption experiments. Many simulations also exist, but they often lack an integrated measurement layer and a visualization that makes patterns obvious. Voyager focuses on combining three things in one place: • real-time simulation at scale, • interactive 3D visualization, • built-in observability for performance and outcome mea- surement. F. Target audience Voyager is aimed at: • sustainable aviation / transportation students and re- searchers, • engineers studying real-time streaming and visualization behavior under load, • stakeholders who want a repeatable sandbox for "what- if" analysis. II. DEFINE THE SCOPE OF THE PROJECT A. Need we will solve We want a sandbox where we can run repeatable scenarios (rush hour, diversions, spikes), measure traffic outcomes, and connect those outcomes back to fuel and emissions estimates. The goal is not to replace controllers; it is to make inefficiency measurable so interventions can be discussed with evidence.